
Read This First: Explore IDE, Code Editor With Android Studio On Windows OS
In the last part, Android Studio in Windows 10 part 2, you were able to design and develop your very first android application in Android Studio IDE. In this part, you will explore the developers, debug tools, and more about the build process provided by the IDE.
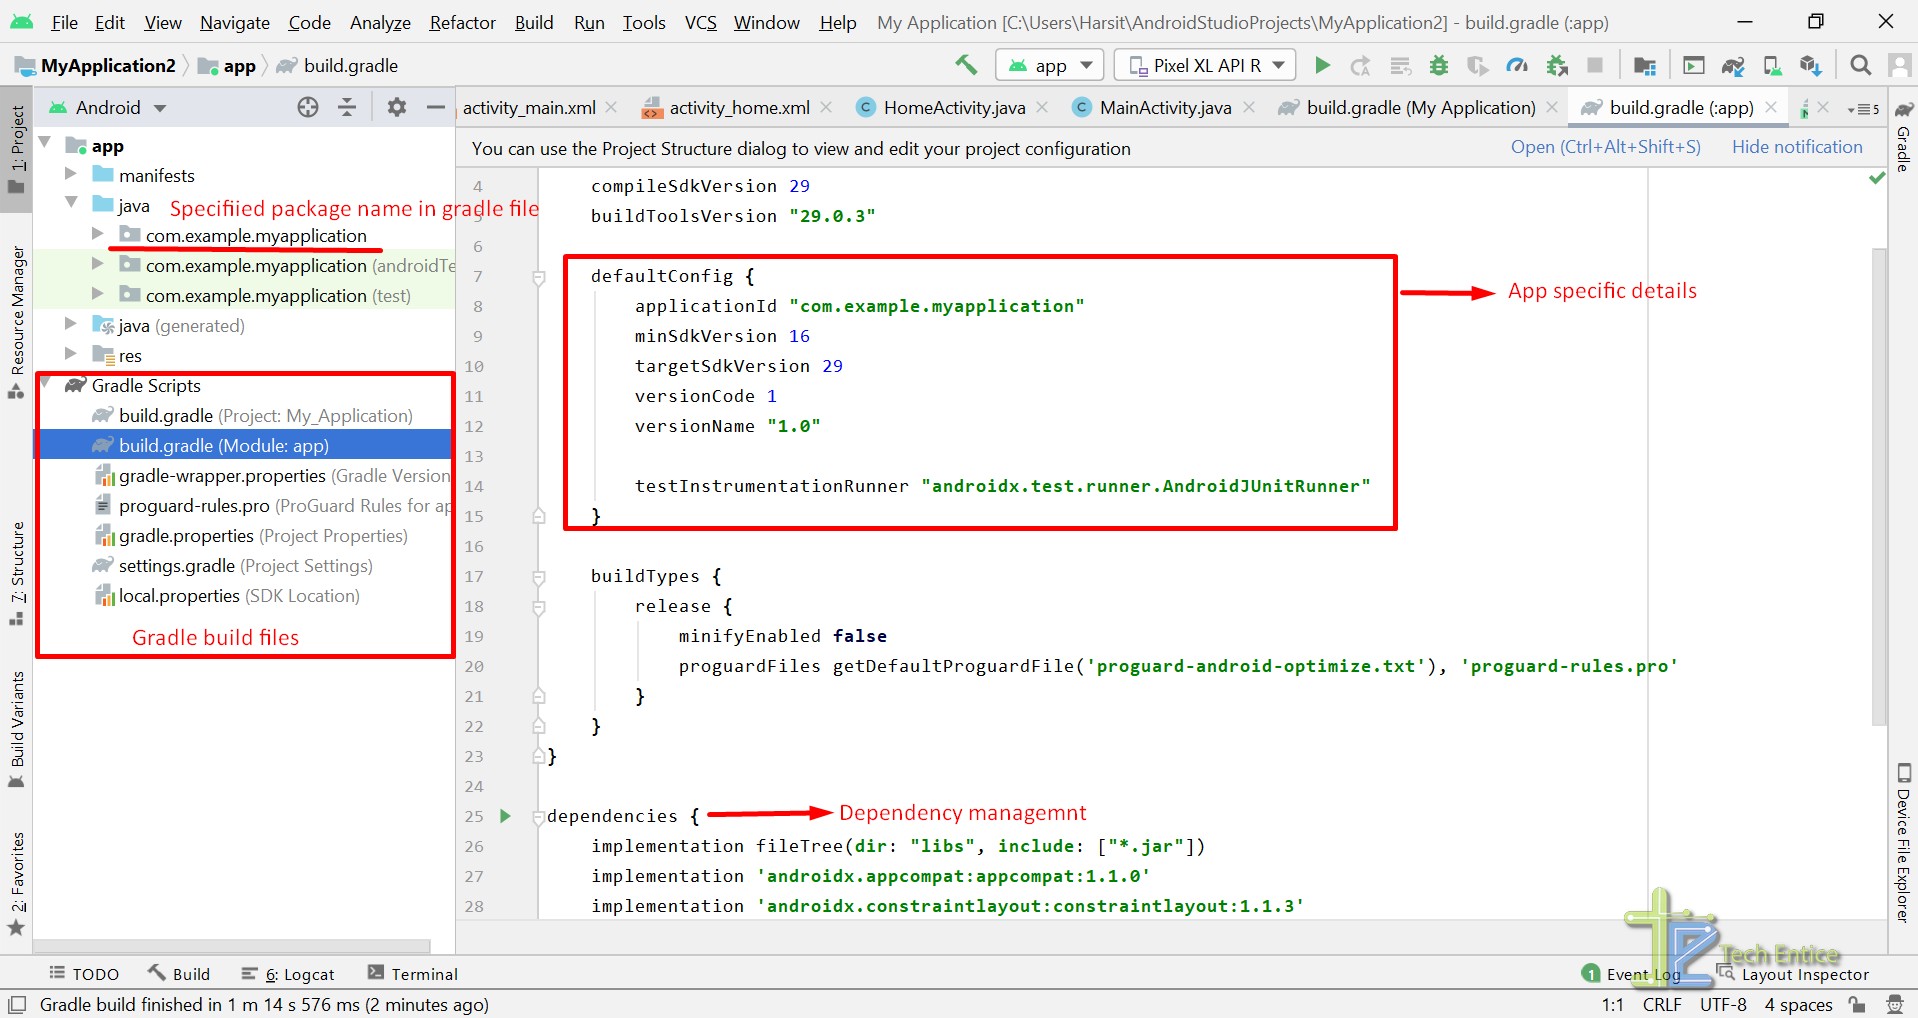
Gradle, The build tool
- Gradle is a build tool that simplifies the whole build process and manages the dependencies of the android project.
- Gradle manages the android application packaging phase. The outcome of the build process is a fine signed android app in apk format ready for either release or debug.
- Whenever you want to test the modified application either in AVD or an externally connected device, Gradle rebuilds the whole package and installs the app with just one click.
- Gradle specifies information such as package name(applicationId), version name, minimum and target SDK, version code, and many more of an android app.
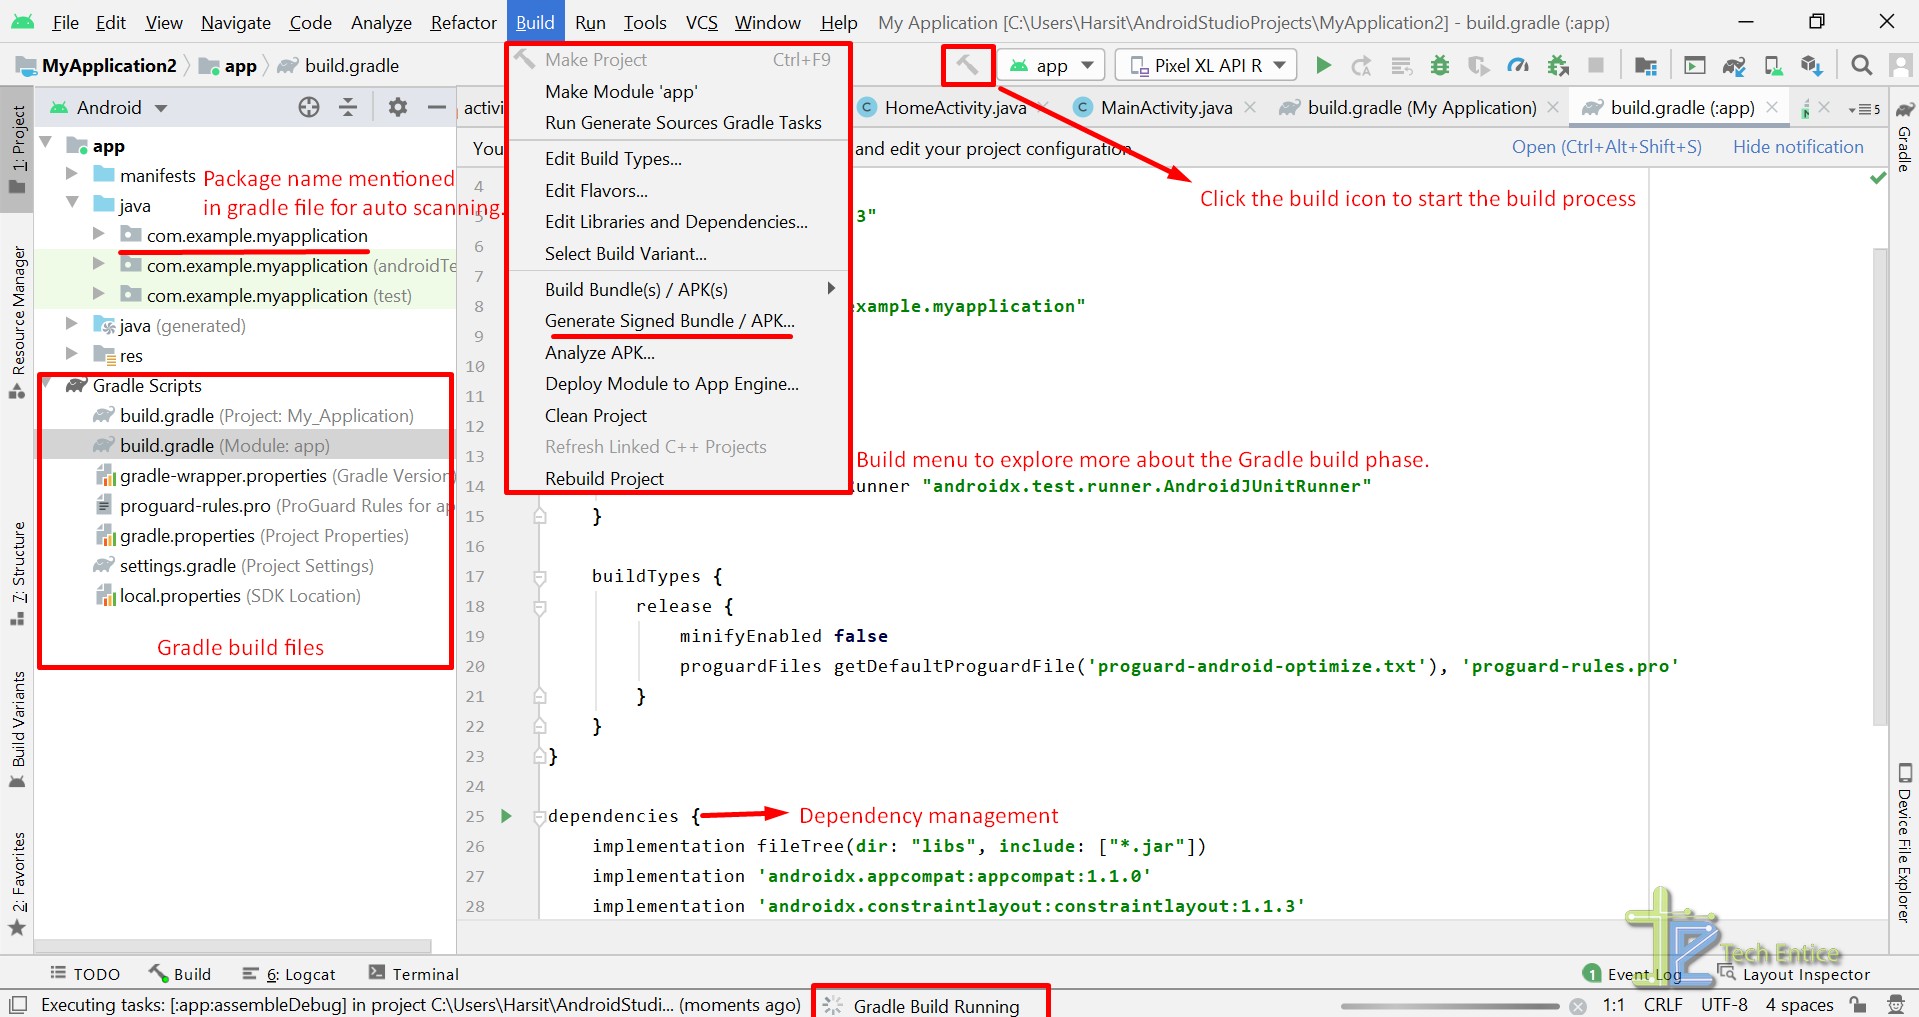
The build phase
Once changes for your android app are in place, it is the time to rebuild your app using Gradle.
- Click the build icon aside of the AVD section, as mentioned in the below screenshot.
- The build process will take a while to finish. You shall be able to see the status, “Gradle Build Running” message at the bottom status bar.
- Once the build process is over, the status bar updates the staus to “The build finished in xyz ms.”
ADB, The debug tool
- Android debug bridge(ABD) is a command-line tool that allows you to communicate to your connected/virtual devices even over wifi.
- ADB facilitates some of the core functionalities, such as installing and debugging android apps.
- ADB grants access to the Unix shell to run a variety of commands on your device.
Logcat, The Logger
- Android Studio provides an integrated logging tool known as Logcat. This tool is very helpful in monitoring the overall application state from a command-line interface.
- For all raised runtime exceptions and errors while running the application, you can see the stack trace in the logcat console, and for purposeful logging, you can use android.util.Log class.
- In most of the run time scenarios, we need to check the correctness of the value of variables; in that case, you can directly log the those in the console.
Let us open the Logcat logger. To see the logger in action, make sure your virtual or physical device is connected, and you are running the Android app.
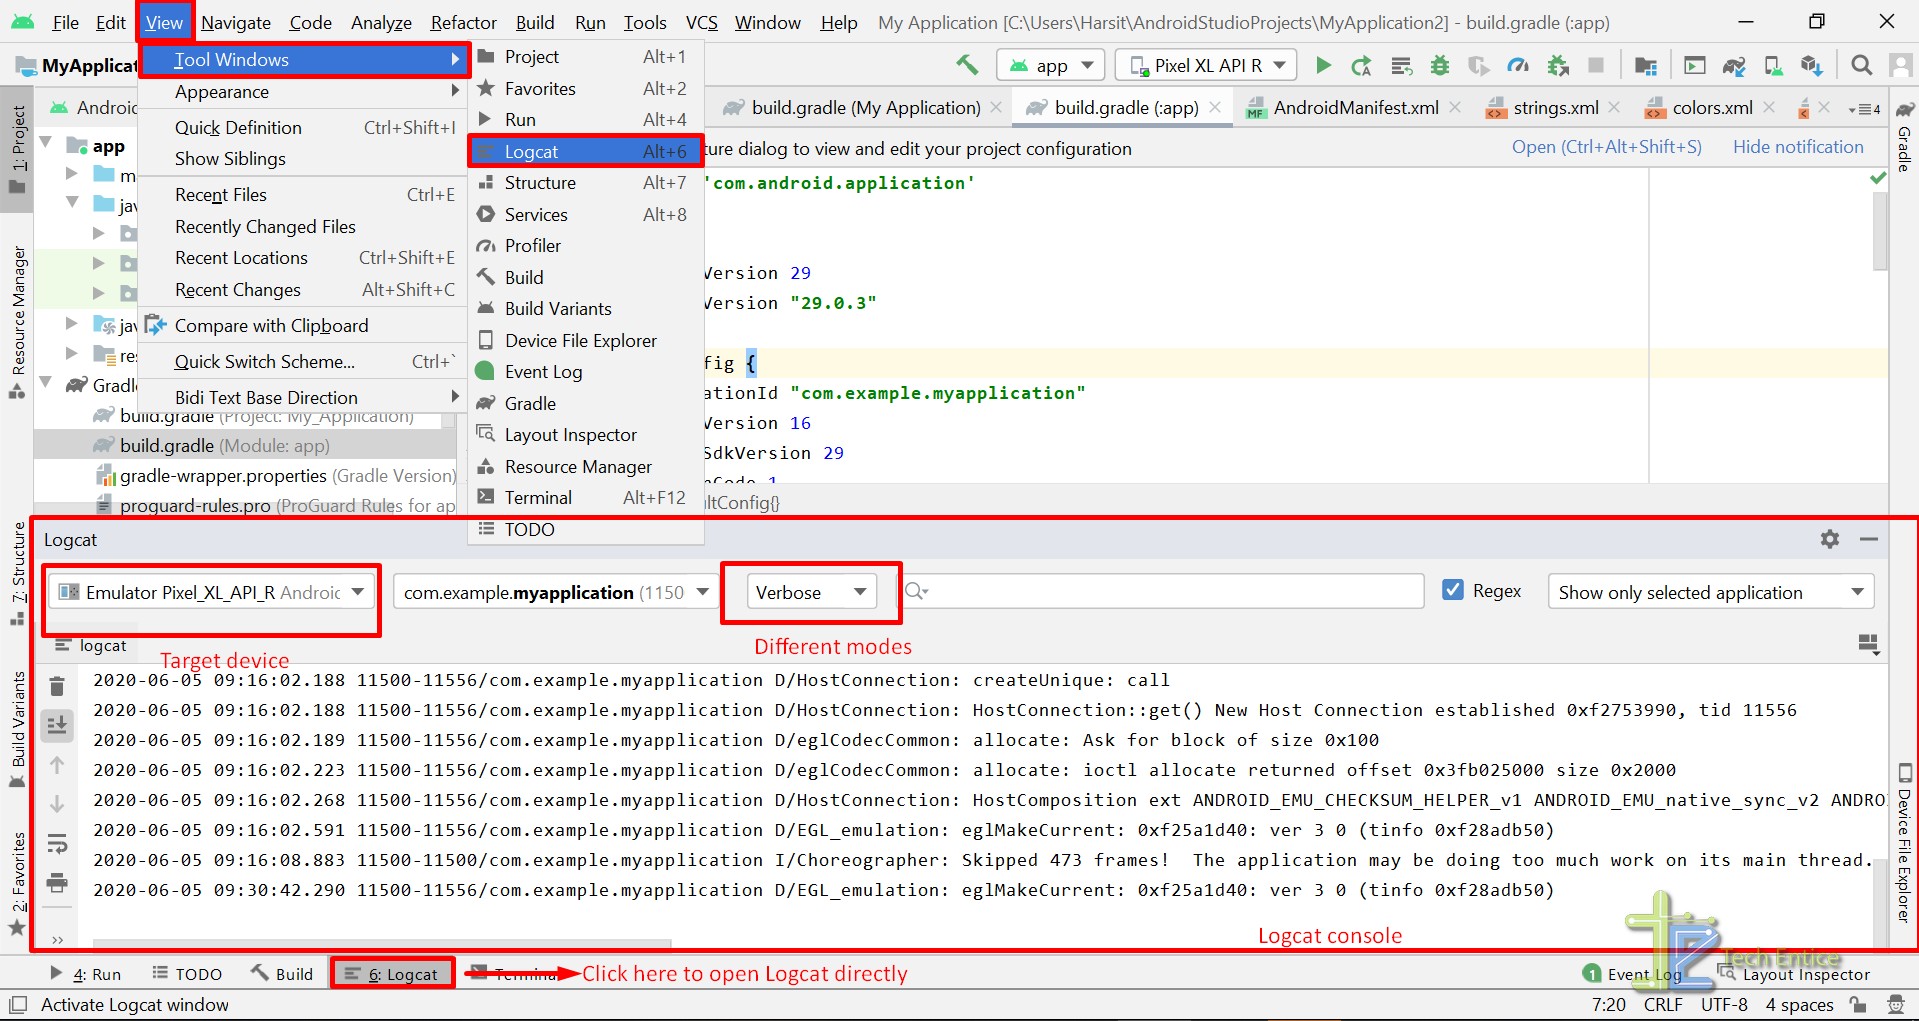
Explore Logcat logger:
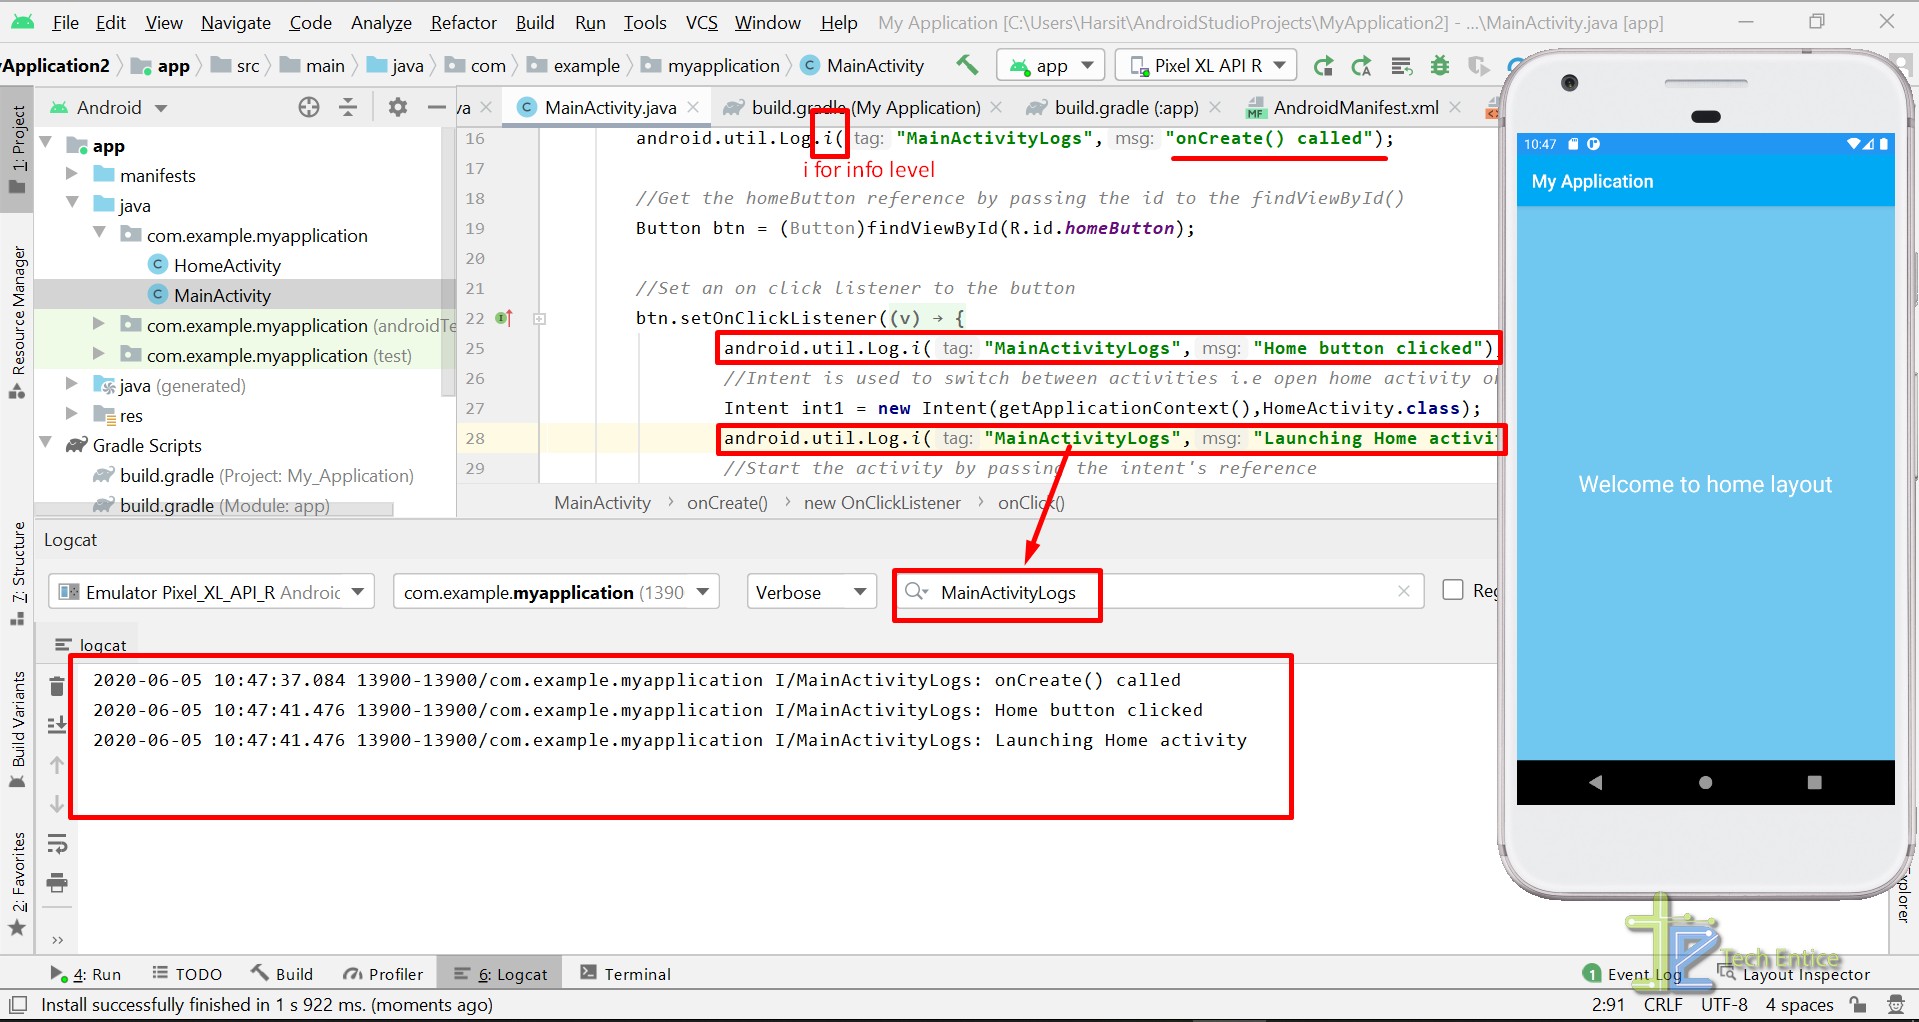
The Logcat window provides a bunch of options to filter and set the logging level for easier debugging. Let us go through all available options available,
- The first drop-down allows you to target the available devices. Typically this option is used when more than one device are connected to the system, or else it picks up the device be default where you are debugging the app.
- The second drop-down allows you to target a specific package that makes it easier to monitor the required logs by hiding irrelevant records.
- The third drop-down will enable you to select the logging level. There are a total of six logging levels available. Let’s discuss each one,
- Verbose: Verbose logging level asks the debugger to show all the messages, i.e., include all the message levels present below it in the drop-down.
- Debug: Debug logging level asks the debugger to show only relevant messages useful during the development phase only. By default, it includes all the message levels present below it in the drop-down.
- Info: Info logging level is typically used as bookmarks in your codebase to check and understand the application flow. Some times it is used to log the variable values to verify the correctness. By default, it includes all the message levels present below it in the drop-down.
- Warn: Warn logging level displays possible issues and warnings but not errors yet. This is very useful, and even fixing warnings can avoid potential application failures in the future. By default, it includes all the message levels present below it in the drop-down.
- Error: Error logging level shows messages related to errors, exceptions, and assert messages generated during debugging.
- Assert: Assert level shows only critical exceptions and errors that the developer expects never to happen.
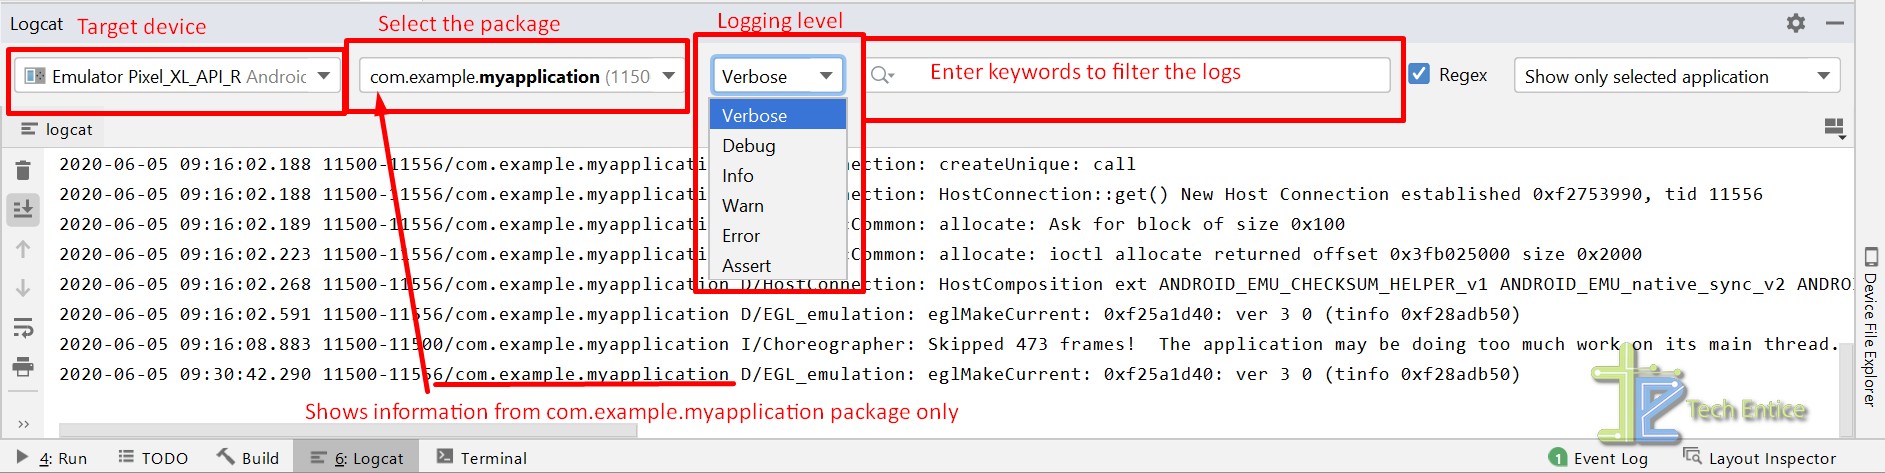
- The fourth text box is a search bar that allows us to filter the logs based on the entered keywords.
- Next, the Regex checkbox will enable you to search using regular expressions.
Please refer to the below screenshot to get a better understanding of how the logging tool is used here,
Debug using breakpoints:
Logcat is useful when you are debugging some minor flaws in your application. When it comes debugging complex applications involves multiple calls with a single click, IDE’s own debug tool can be beneficial using the breakpoints.
This feature is helpful when you need to debug your application during the execution. You can put breakpoints in our java code to pause the execution at the specified breakpoints and then can verify various parameters and variable values.
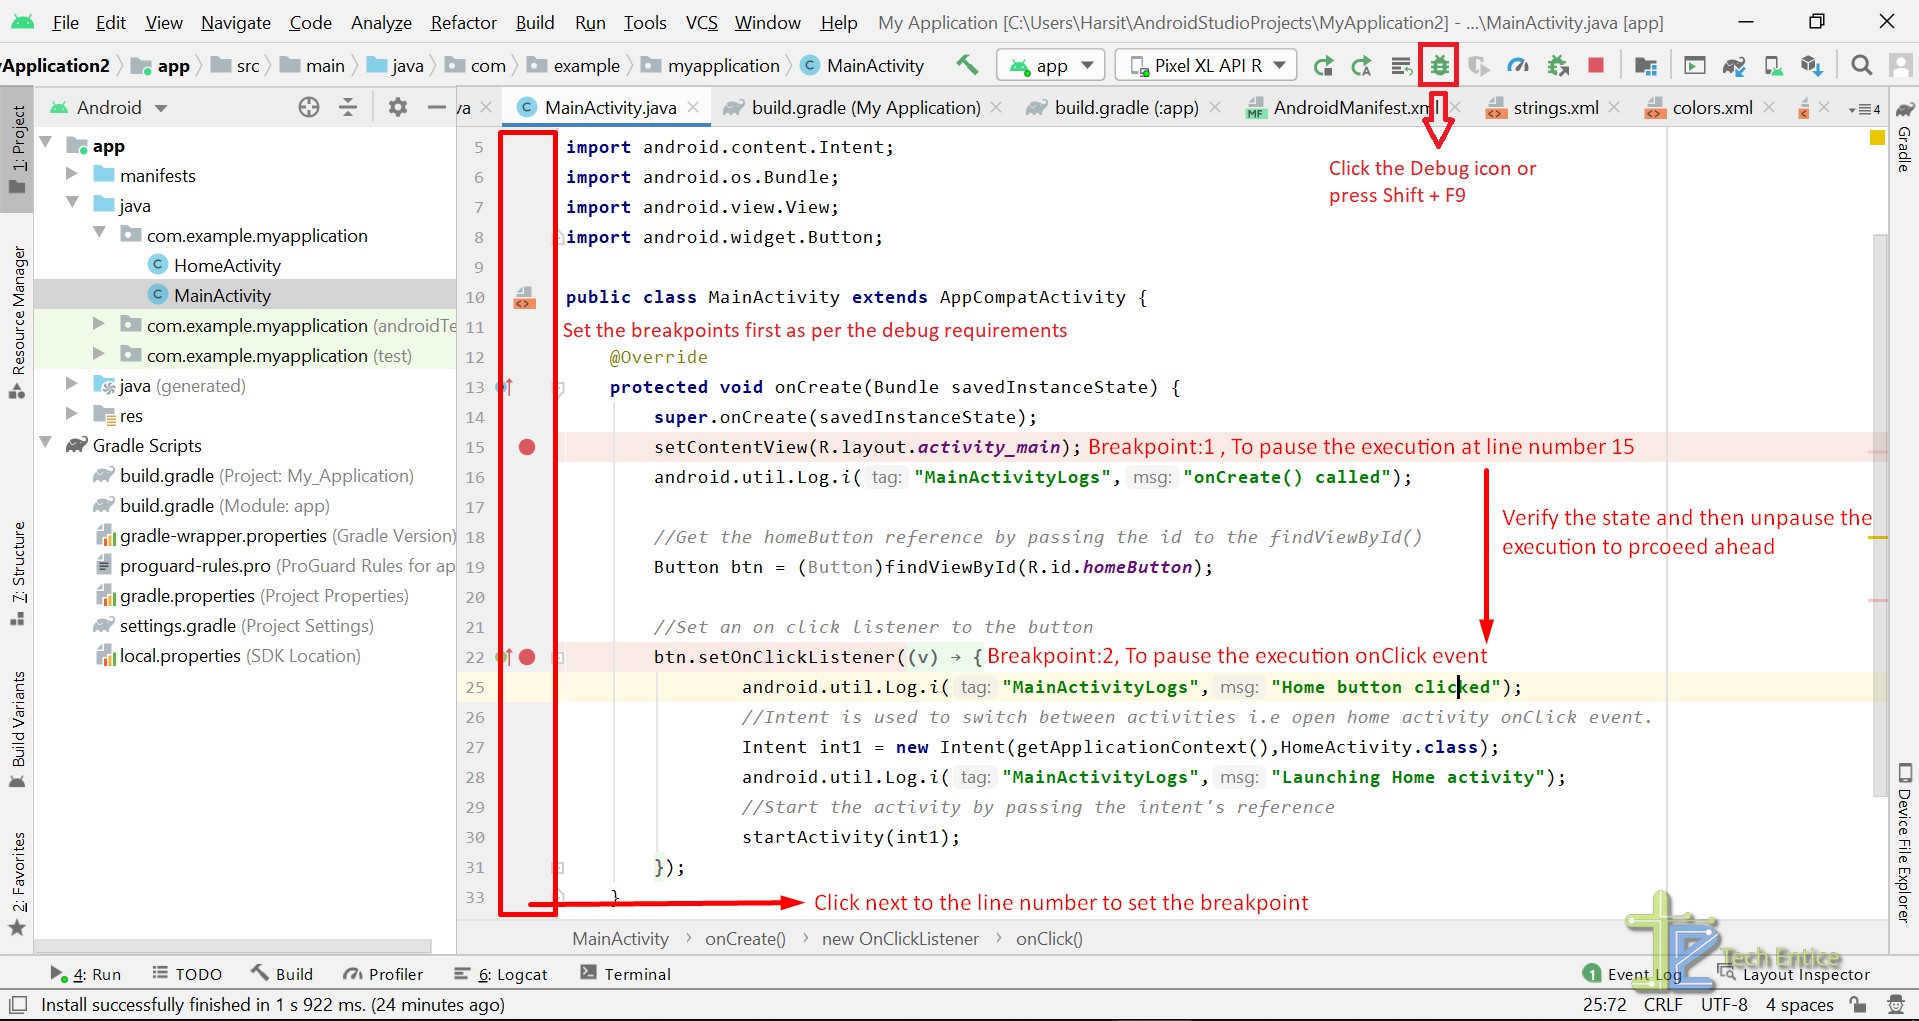
- You can set the breakpoints by clicking the grey area next to the line numbers.
- Once the breakpoint is activated, you will see a red dot next to the line number.
- Then click the Debug icon or press Shift + F9 to launch the app in debug mode.
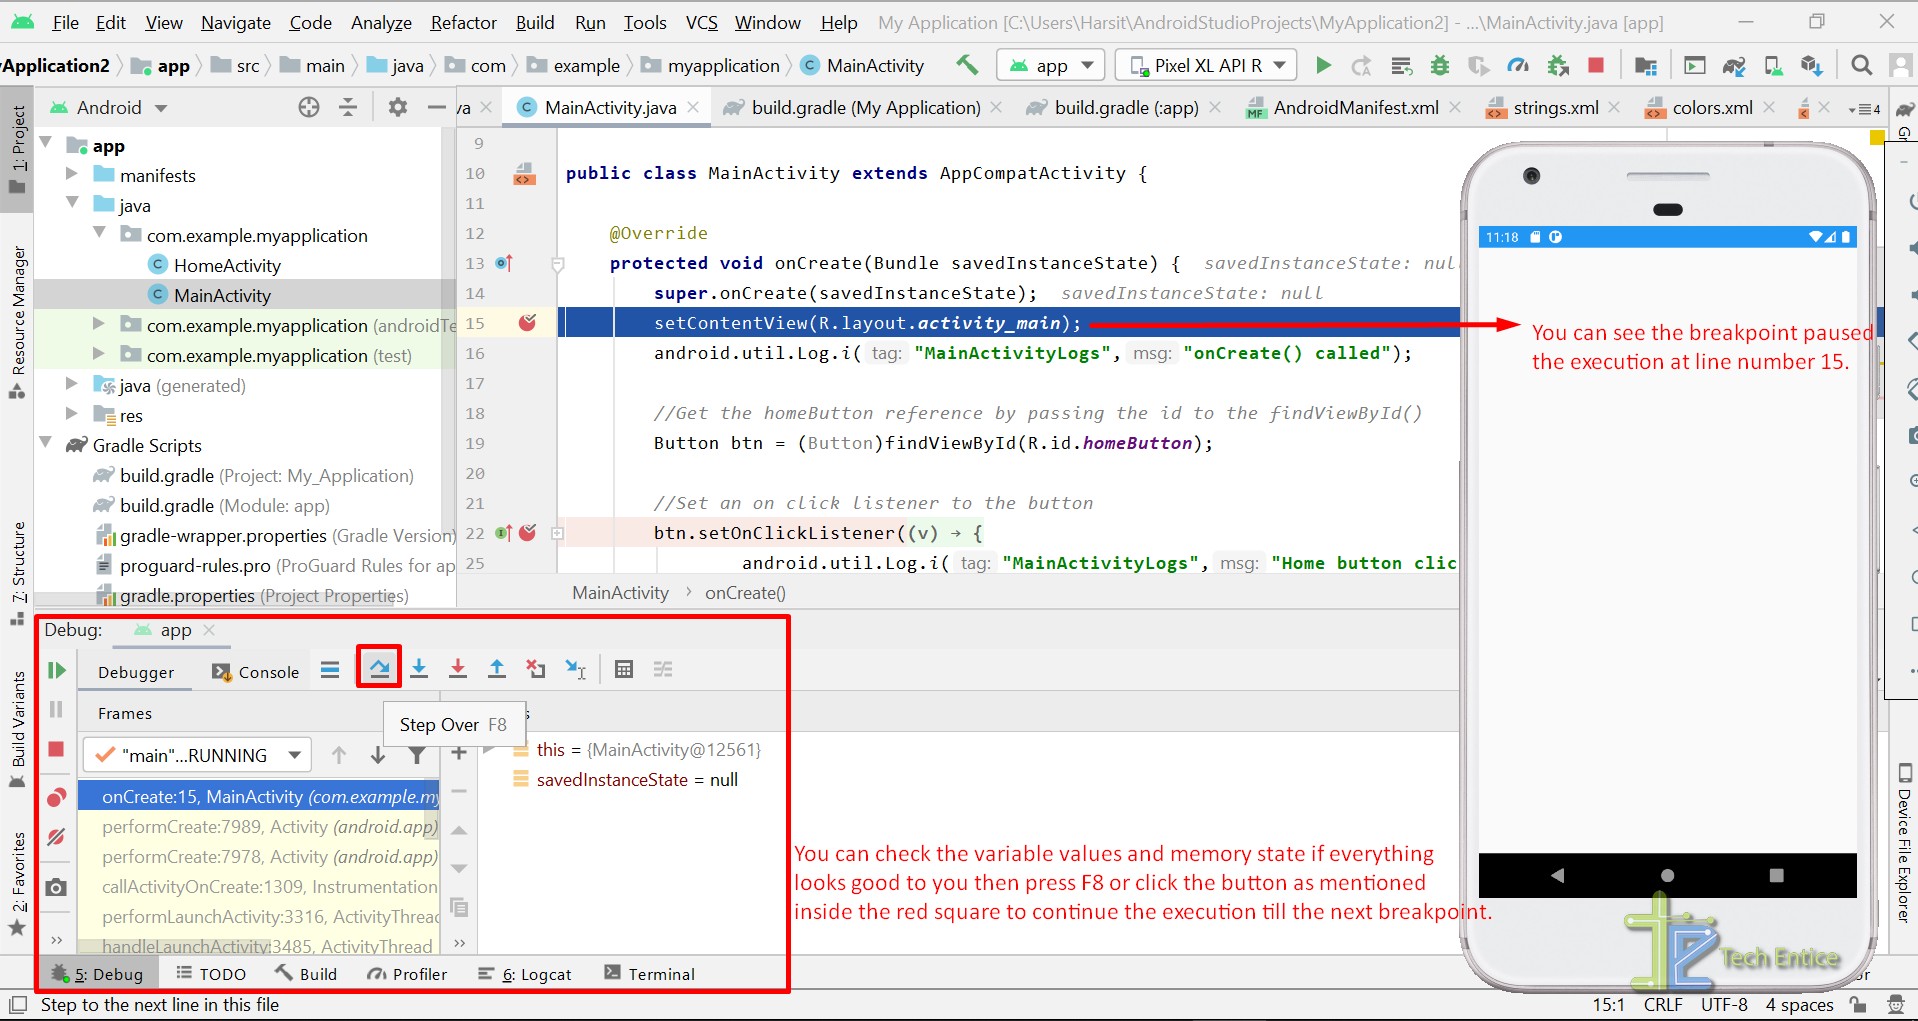
- At the specified first debug point, the execution pauses and the IDE provide you with the below dialog to debug more by analyzing current memory values.
- Once you get the required metrics, you can press F8 or click the mentioned icon for stepping over.
- The execution continues till the next breakpoint, and you need to repeat the process.
- Once the
The Lint tool
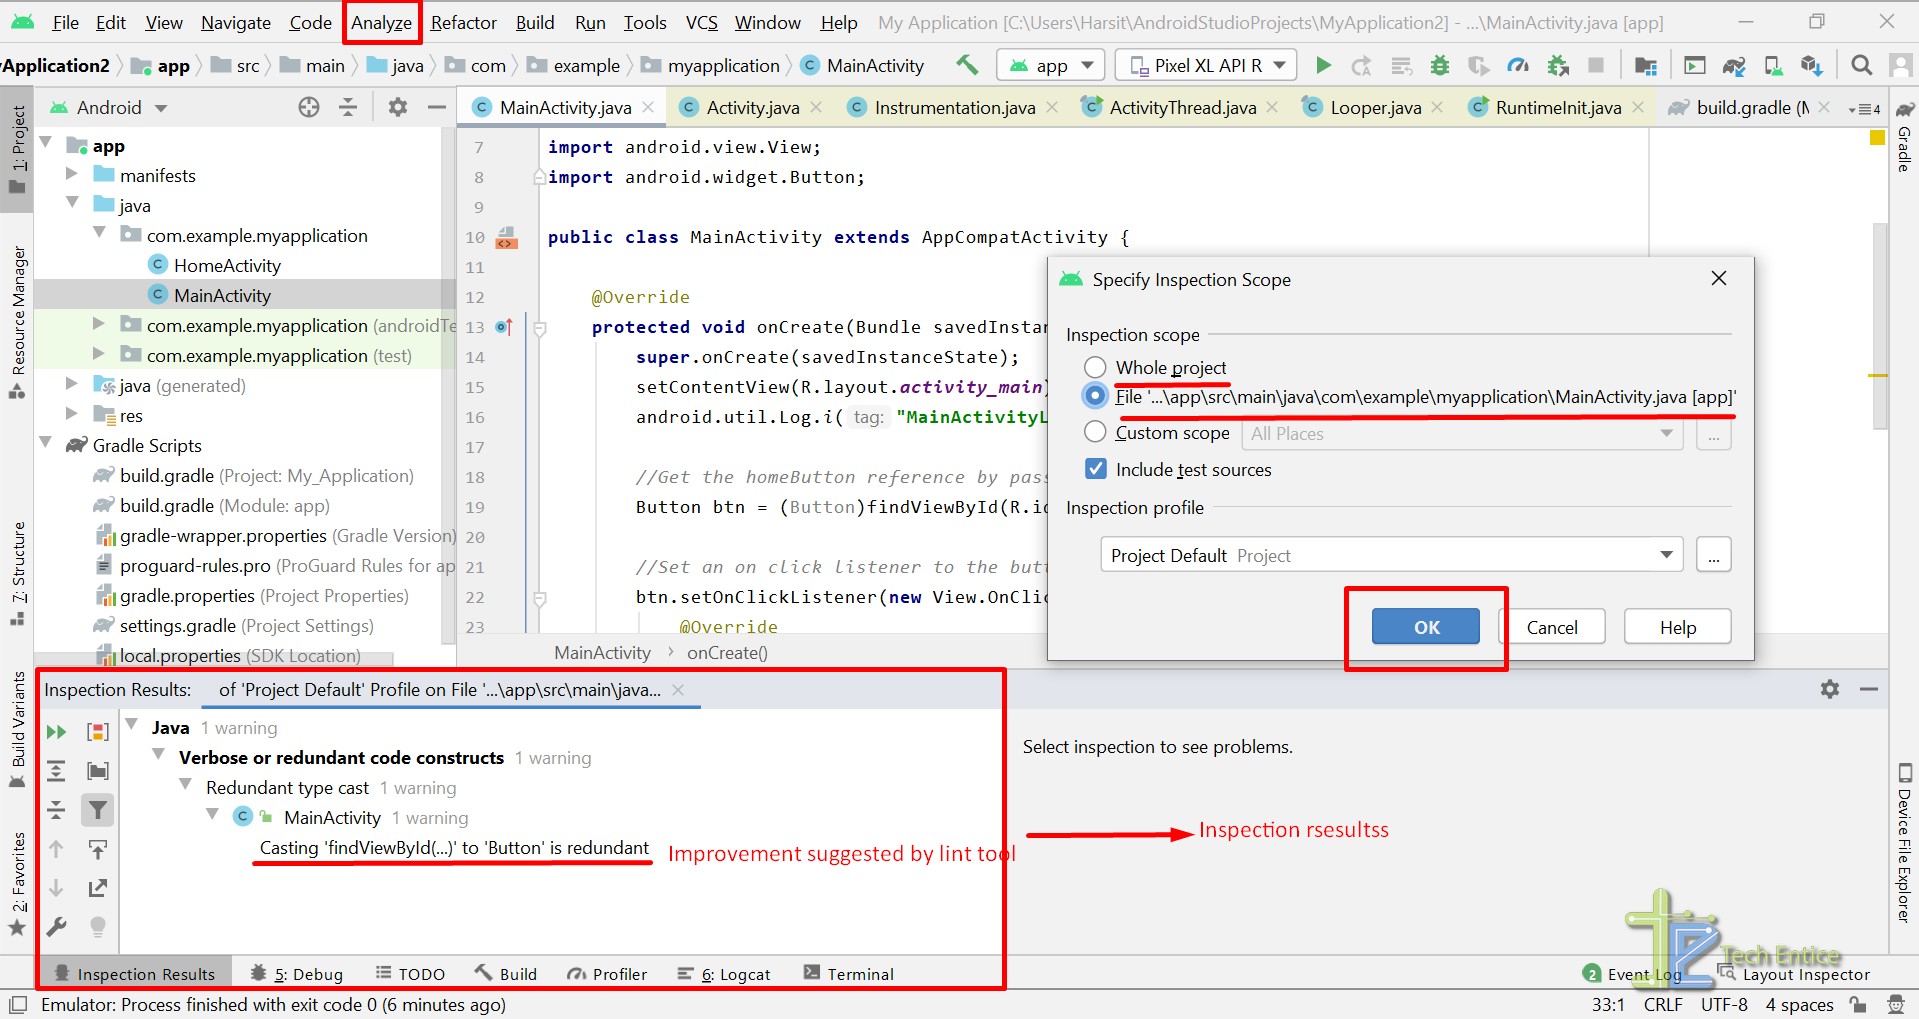
No matter how good developers we are, there’s always a possibility of leaving nasty code behind. Lint tool allows us to check the quality of the code, suggests improvements, highlights security loophole, and many more.
- Hover on the Analyze section and then click the Inspect Code option to launch the Lint tool.
- Then the below-mentioned dialog will appear on the screen, make the required selection, and click the Ok button.
- It will take a while to lint the selected files and shows the inspection results, as mentioned in the screenshot.
Summary
In this article, we have explored many essential developers and debug tools coming with the IDE. Many third-party plugins can be integrated with the IDE for easier debugging. Don’t forget to check out the plugins available for Android Studio.